The Trading Platform
Every function on the platform is a stand-alone application, called a "Widget". These can be moved, resized, closed and even saved to a custom layout. There is a default layout for you to use, with many other possible widgets you may add and arrange.

Widgets
The primary trading widget, displaying prices in real-time.
In the top left of the chart there is a  dropdown list to change the asset. With this dropdown open you will be able to select any of the symbols to trade with.
Below the asset dropdown list, there is another 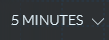 dropdown for the time intervals in the chart, from 1 second up to 1 week.
This can also be changed below the chart in a simpler way.\ 
Depending on how wide is your chart, somewhere (usually in the top center of the chart) there will be six icons for you to choose from.
The first:  toggles on and off the price information box that follows your mouse.
The second:  opens/closes the drawing tools menu. This gives you an array of ways to draw on your chart, including coloring and text.
The third: 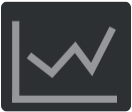 allows you to manage what type of chart you display, with default being Candlesticks. It also allows combining more than one chart type in one, or adding other chart sections to display the asset in differently in two or more charts. The addition of a second chart section also will open up other Indicator options, such as MACD and Market Facilitation Index.
The fourth:  if turned ON and you zoom in, for example, it zooms in the price as well. If you zoom out, same. If it's turned OFF, whenever you zoom, the price stays at the same place, it doesn't scale it for you.
The fifth:  will show any events that are going to happen or have happened for the symbol you've selected in the chart.
The sixth:  allows you to edit some extra chart settings, like background and grid color, orders & positions configuration, series type and size.
This widget shows the Balance, Margin Used, Margin Available, Daily Profit/Loss, and Open Profit/Loss, for each of your Accounts. It also shows Financing Fees for Forex accounts.
This widget shows the amounts of buy and sell orders at different prices and times, for a particular asset.
With this widget you can see the current trade activity of a particular asset. This includes the time, price, bid, ask and volume of specific trades, as well as overall bid/ask/last price/percentage change.
In the notifications widget, you can see the history of your orders being placed and filled.
Check this widget to see the details of your open positions. You can see the date and time you entered the position. It will also display: the asset code, if it was a buy (shown as a blue positive number) or a sell (a red negative number), the type of order, and the price you entered.
This widget shows your orders, sorted either by: All, Working Orders, Filled Orders, and Cancelled Orders. The details include the asset, buy/sell, quantity, type of order, and the price.
This widget will allow you to specify favorite assets. Simply click the pencil icon in the corner of the widget, then click the star (so it fills in) beside each asset you want as a favorite. You will see a graph and price movements in the widget itself. In addition you can see these assets in the favorites list for selection on the chart.
This widget adds a clock to your layout, showing your current time, or times in other important trading timezones if you prefer.
This widget shows an asset's consolidated data of the volume of buy and sell orders at different prices, centered around the current price. You can also see the overall price data and quantity. It even has its own sets of buy and sell order buttons.
Updated over 1 year ago